Industries with High Relevance of Free Cash Flow Yield

Educational content only. This analysis is for informational purposes and does not constitute financial advice or a recommendation to buy or sell any security. Data sourced from SEC EDGAR filings and company earnings releases. Verify figures independently before making investment decisions.
Industries with High Relevance of Free Cash Flow Yield
A 4% free cash flow yield at a utility company and a 4% yield at an early-stage software company mean completely different things. The business model determines what's achievable, what's normal, and what's suspicious. Here's how FCF yield calibrates differently across the four main industry types.
Mature and stable industries
Utilities and consumer staples tend to carry the highest and most predictable free cash flow yields. The reason is structural: their revenue is recurring, their capital expenditure needs are well-understood, and they've long since passed the growth investment phase. What's left is cash, and a lot of it relative to the business's market value.
For income-focused analysis, this is where FCF yield does its best work. Dividend sustainability isn't about whether earnings cover the payout; it's whether free cash flow does. Telecom sits in a similar category; Verizon (VZ) generates $18.3B in annual FCF from a network that was built out years ago. Pharmaceuticals with established drug portfolios follow the same logic: our Bristol-Myers Squibb (BMY) FCF analysis shows $12.85B in annual FCF from a diversified oncology portfolio.
A higher-than-average FCF yield within these sectors can indicate an undervalued stock or a business generating more cash than the market is crediting it for. Just watch for the red flags that can inflate the number temporarily, deferred maintenance CapEx being the most common.
For mature industries, free cash flow yield is particularly useful for assessing dividend sustainability. See the full case for using FCF Yield over earnings-based metrics.
Capital-intensive industries
Energy and materials companies require massive ongoing investment in physical assets: refineries, pipelines, mines, tankers. That investment doesn't stop when the asset is built; it has to be maintained and eventually replaced. FCF yield in these sectors is consequently more volatile, and more cyclical, than the headline earnings number suggests.
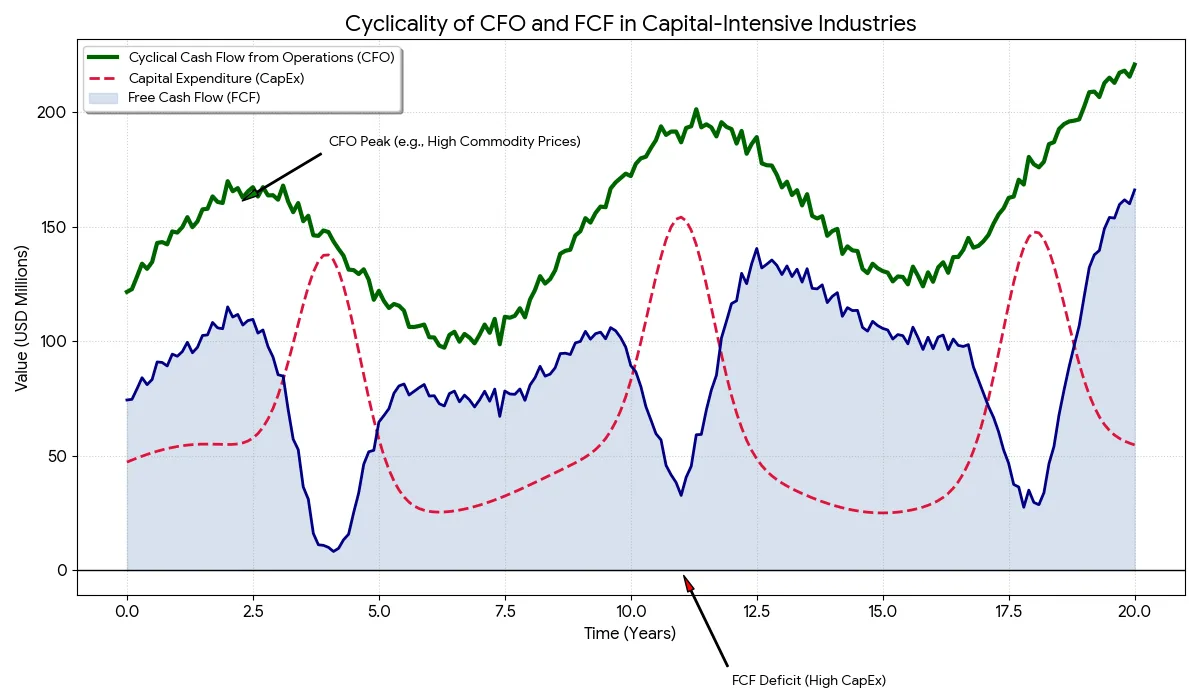
Commodity prices compound this. In a high-price year, these companies can look extraordinarily cheap on FCF yield: 15%, 20%, sometimes more. But that yield is partly a function of where oil or copper happens to be trading, not just how well the business is run. The more useful question is what FCF yield looks like through the cycle, not at the peak.
Our Chevron (CVX) FCF analysis illustrates the range: from a $37.6B peak to $15B as commodity prices and CapEx dynamics shifted. Shipping is similar. Teekay Corp (TK) posted a 92% FCF conversion rate, but the metric needs to be read in the context of where the shipping cycle sits.
Growth-oriented industries
Growth companies, particularly in technology, often show lower FCF yields because they're deliberately reinvesting cash into expansion rather than letting it accumulate. Google's free cash flow dropped sharply during its AI infrastructure buildout as server CapEx surged. That's not a red flag; it's a conscious capital allocation decision that analysts need to read correctly.
The exception worth watching: mature software businesses that have already built their infrastructure. Once the platform is built, CapEx drops dramatically and FCF margins expand. Dropbox (DBX) is a clean example. The company now generates a 14%+ FCF yield because the heavy lifting happened years ago. In these situations, a high yield signals a business that has crossed from reinvestment mode into harvesting mode.
Real estate
Real estate is where FCF yield analysis gets most nuanced. REITs are legally required to distribute most of their taxable income, so the earnings-to-payout ratio is almost always compressed. What matters is cash generated from rents after operating expenses and maintenance CapEx, relative to market cap.
The relevant variables: occupancy rates, rental growth trajectory, how aggressively management is categorizing maintenance as "improvements" (which would lower CapEx on paper), and geographic concentration risk. A high FCF yield at a REIT in a deteriorating property market means something very different than the same yield in a growing one. Compare within property type and location before drawing cross-REIT conclusions.
The core lesson: FCF yield benchmarks aren't universal. A 10% yield is compelling at a utility, normal at an energy company mid-cycle, worrying at a growth tech company that should be reinvesting, and requires context at a REIT. Always establish the sector baseline before deciding whether a yield signals value or signals a problem.
Data Sources & References
Financial data referenced in this article is drawn from primary sources:
- SEC EDGAR: company 10-K, 10-Q, and 8-K filings
- Investor letters from Berkshire Hathaway, Fundsmith, and other publicly available sources
- Academic research and central bank publications where cited inline
Investments involve risk. Past performance is not indicative of future results. This content is for educational purposes only and is not investment advice.
Related Reading
- Lyft (Ridesharing): from $352M burn to $1.1B FCF
- Ollie's Bargain Outlet (Retail): expansion CapEx compressing FCF
- Skyworks Solutions (Semiconductors): structural FCF decline
- FTAI Aviation: GAAP vs. adjusted FCF divergence
- Globant (IT Services): high-margin FCF in emerging-market tech
- How to Screen Stocks by FCF Yield: sector thresholds explained