The Advantages of Free Cash Flow Yield in Investment Analysis

Educational content only. This analysis is for informational purposes and does not constitute financial advice or a recommendation to buy or sell any security. Data sourced from SEC EDGAR filings and company earnings releases. Verify figures independently before making investment decisions.
Why Free Cash Flow Yield Beats Earnings-Based Metrics
Pick up any earnings release and the first number cited is usually EPS. But reported earnings are an accountant's construction: they include depreciation schedules, amortization of acquired intangibles, and accruals that may have nothing to do with cash actually landing in the company's bank account. Free Cash Flow Yield (FCFY) cuts through that. It measures what the business actually keeps after paying its bills and maintaining its assets, expressed as a percentage of market cap. Three things make it worth building into any analysis.
It's harder to fake
The core advantage of free cash flow yield over earnings-based metrics like P/E is straightforward: cash flow is harder to manipulate. Management can accelerate revenue recognition, capitalize expenses, or apply aggressive depreciation assumptions to move earnings around quarter to quarter. The cash flow statement is more constrained; cash either moved or it didn't.
That said, FCF isn't manipulation-proof. Companies can defer capital expenditures to temporarily inflate free cash flow, or classify operating cash outflows as investing activities. This is why assessing FCF quality, not just the headline number, matters. But as a starting point, FCFY gives you a cleaner signal than EPS.
Strong FCF creates room to maneuver
A company generating substantial free cash flow has options that loss-making or marginally profitable competitors simply don't have. It can pay down debt without raising equity, repurchase shares when they're cheap, fund R&D without needing external capital, or make acquisitions from a position of strength rather than desperation.
This is what's meant when analysts talk about "financial flexibility." It's not a vague quality; it's the direct consequence of generating more cash than the business needs to operate. A robust FCFY tells you the company is past the survival question and into the allocation question: what's the best use of this surplus? Companies with strong free cash flow yield have more room to weather economic downturns and capitalize on growth opportunities when they arise.
It puts companies on a common footing
One of FCFY's underrated uses is cross-company comparison. Two companies with similar P/E ratios can have vastly different cash profiles: one earns $1 in EPS and keeps $1, the other earns $1 and uses $0.60 of it maintaining aging equipment. Free cash flow yield surfaces that difference.
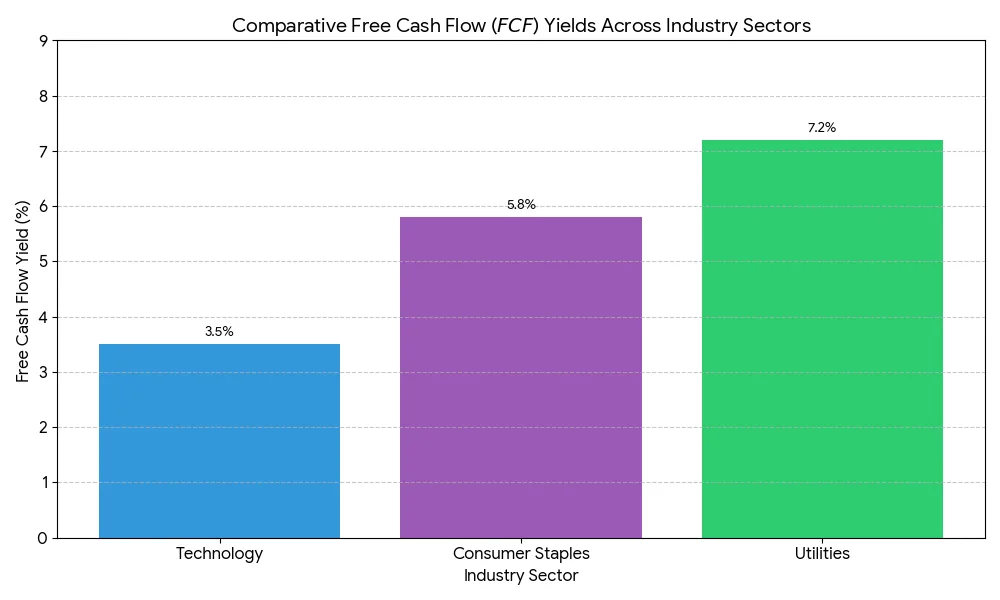
The caveat is that industry norms vary significantly. A 3% FCF yield is normal for a fast-growing software company reinvesting everything into expansion; the same yield at a regulated utility would raise questions. When comparing companies, always compare within sector first, then across sectors with context.
A simple example: two retail companies, one with an 8% FCFY and one with 5%. The first is generating more cash per dollar of market cap, a legitimate signal of either better operations or an undervalued stock. But check whether CapEx was artificially low that year before drawing conclusions.
Free cash flow yield doesn't replace a full analysis; you still need to check the balance sheet, understand the business model, and watch for important red flags. But as a first filter, it's more honest than P/E, more intuitive than EV/EBITDA, and harder to dress up. That's why it appears in the toolkit of most serious value investors. If you're building your own framework, start with understanding how FCF yield is calculated, then layer in quality assessment to know whether the number you're looking at is real.
Data Sources & References
Financial data referenced in this article is drawn from primary sources:
- SEC EDGAR: company 10-K, 10-Q, and 8-K filings
- Investor letters from Berkshire Hathaway, Fundsmith, and other publicly available sources
- Academic research and central bank publications where cited inline
Investments involve risk. Past performance is not indicative of future results. This content is for educational purposes only and is not investment advice.